36-to-1 Conflict-to-Repair Gap
The Signal Is Rare · Grey Mirror research
Affection is easy to find in a message history. What happens after an argument is a different question.
By Layne Weant · Published · Updated
Conflict and repair across 44 full message histories
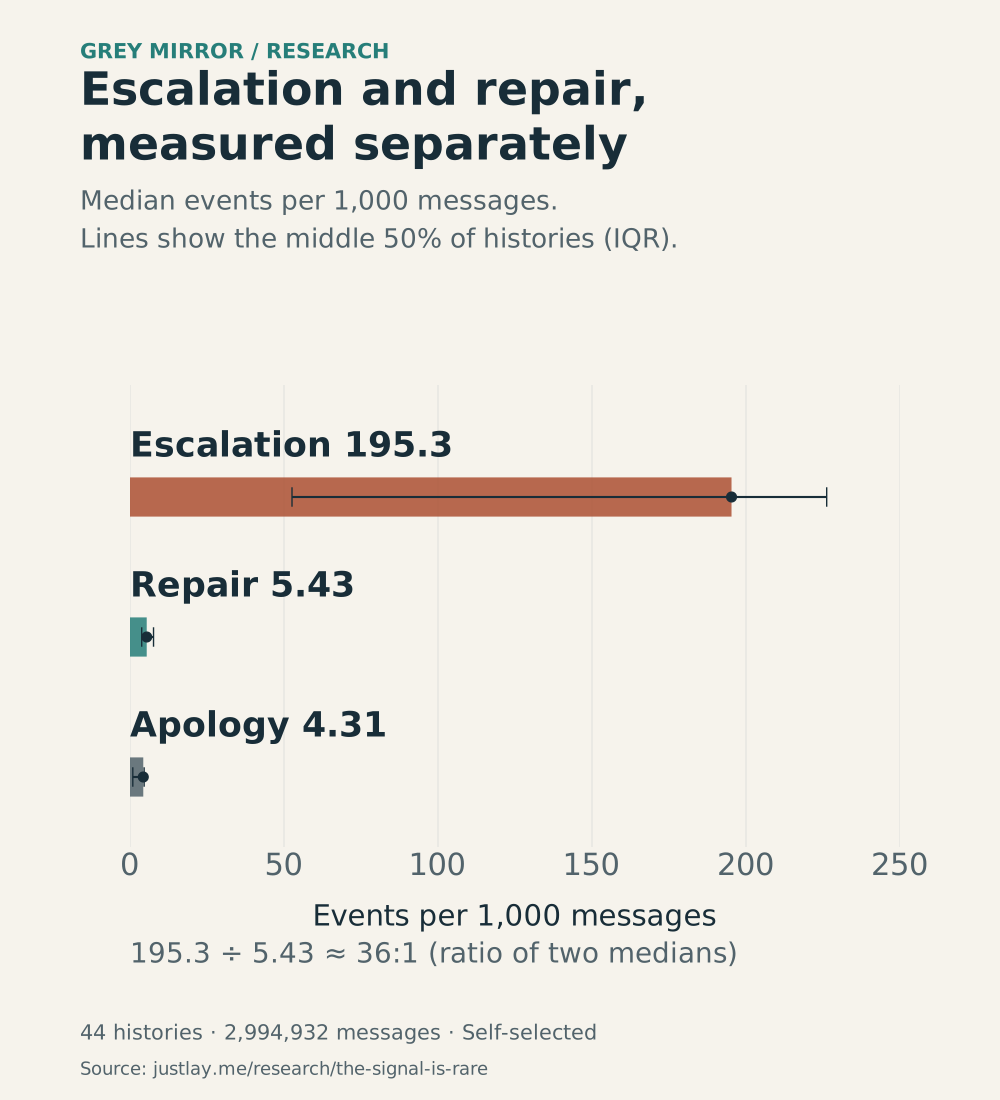
Across 44 self-selected relationship histories containing 2,994,932 messages, Grey Mirror measured median escalation of 195.3 events per 1,000 messages and median repair of 5.43. Dividing those medians gives roughly 36 to 1. This is not a pooled count of arguments or a ratio found in every relationship. Only five histories showed more repair attempts than escalation events.
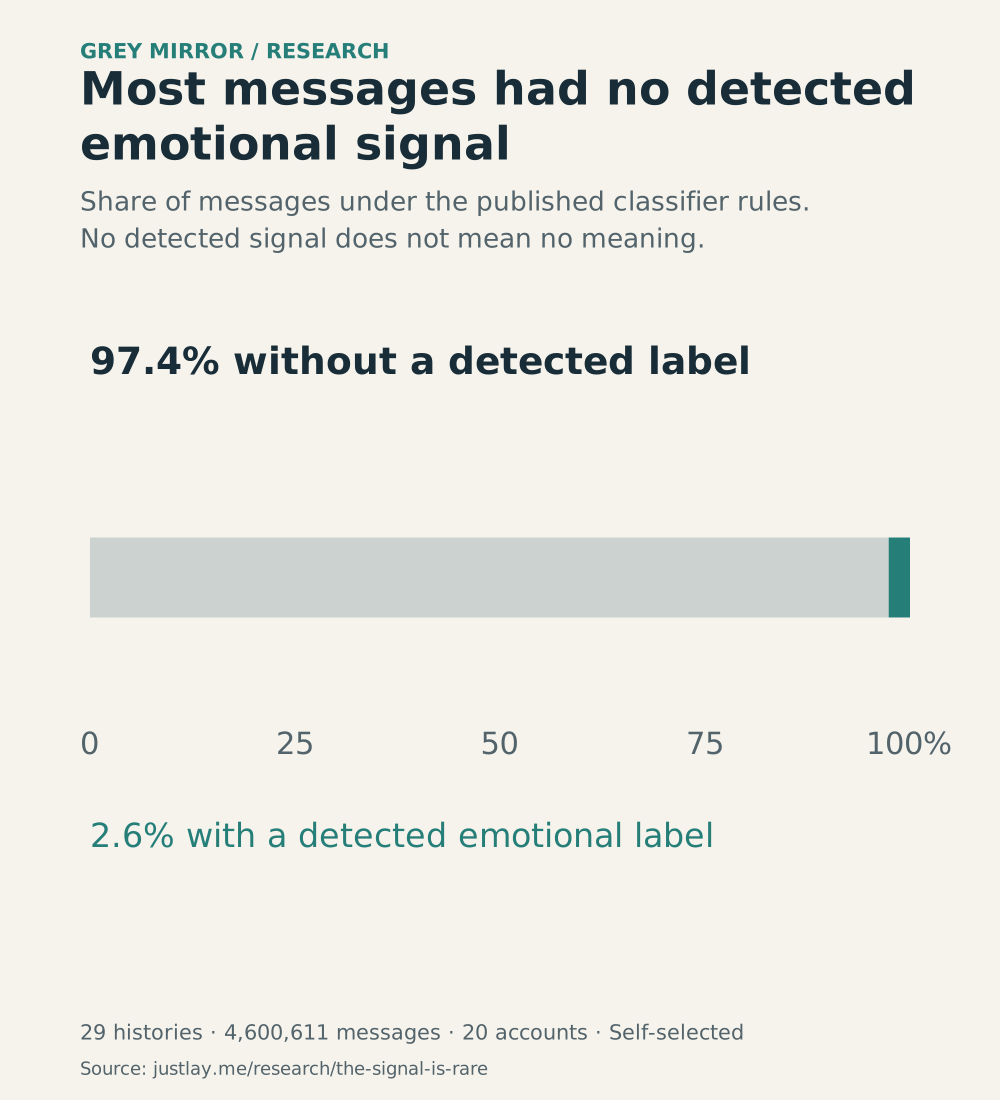
A separate cohort contained 4,600,611 messages across 29 de-duplicated histories from 20 accounts. Under the study’s classifier rules, 97.4% carried no detectable emotional signal. These messages still contain the ordinary work of a relationship: arranging dinner, sharing an address, asking someone to pick something up. The result tells us how rarely the measured emotional categories appeared, rather than how much those conversations mattered.
The cohorts may overlap and their message counts are not added together. Each chart below names the cohort it describes. The data release contains aggregate findings, never private conversations.
An affectionate reply and a repair attempt do different jobs
After a difficult exchange, a warm message can reopen contact while leaving the original problem unanswered. An attempt at repair addresses the rupture: acknowledging an action, returning to a concern, or trying to reconnect after conflict. We measured affection, escalation, apologies and repair separately so that one positive sentiment score would not conceal those differences.
In the 44-history conflict cohort, the median escalation rate was 195.3 events per 1,000 messages. Repair was 5.43; apologies were 4.31. The chart shows each median and its interquartile range, the middle half of the histories. An apology and a repair label can overlap, so these rates should not be added together.
The 36-to-1 headline is the ratio of the escalation median to the repair median. It is not 36 fights per apology, and it is not a rule about your relationship. It describes these particular histories.
Most of a conversation is ordinary life
The 97.4% finding matters because it makes the denominator visible. Pulling out twenty emotional messages tells you little about a history containing hundreds of thousands of messages. The baseline lets you ask whether a pattern is recurring, growing, or unusual for these two people.
Within the 29-history signal cohort, affection labels appeared about 10.7 times as often as explicit repair labels. That is a different measurement from the conflict cohort’s 36-to-1 gap. Neither number tells us whether an argument was resolved outside the conversation.
The histories did not all look alike
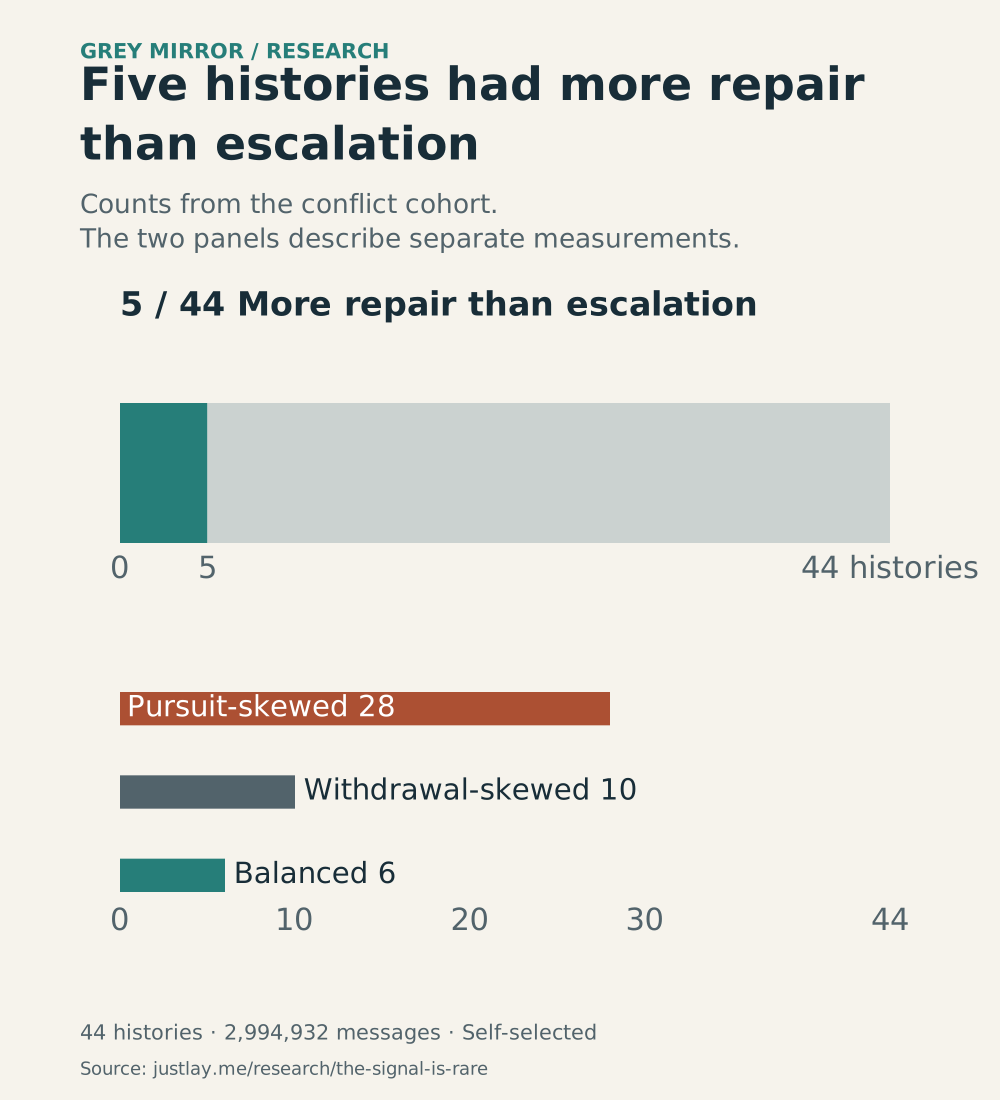
Only five of the 44 histories had more detected repair attempts than escalation events. Thirty-nine did not meet that condition. The second panel shows another measurement from the same cohort: 28 histories were pursuit-skewed, ten withdrawal-skewed and six balanced.
Those are two separate summaries. The data release does not identify which histories belonged to both groups, so the chart does not suggest that one caused the other. Counts are shown directly, without a relationship-health score.
Reply speed gave us no clear story
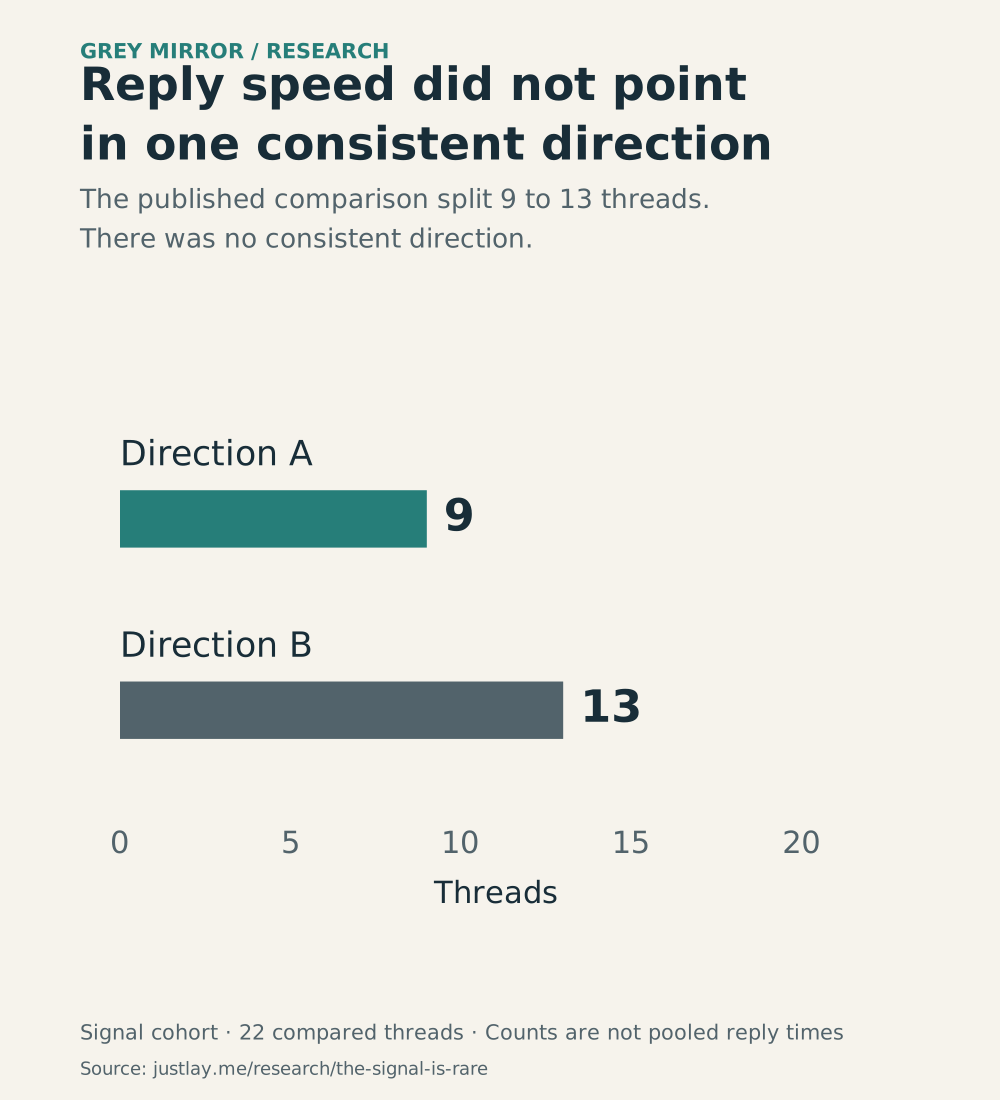
The reply-latency comparison split nine threads in one direction and thirteen in the other. That was too inconsistent to support a headline about who replies more slowly. The chart shows the 22 compared threads; it does not invent results for the rest of the 29-history cohort.
Timing can still matter inside your own history. A change from the usual rhythm deserves context: work, sleep, travel, an agreed pause, or a question that remained unanswered. This aggregate result gives no basis for saying that a slow reply proves detachment.
We also checked whether the detector would invent a turning point
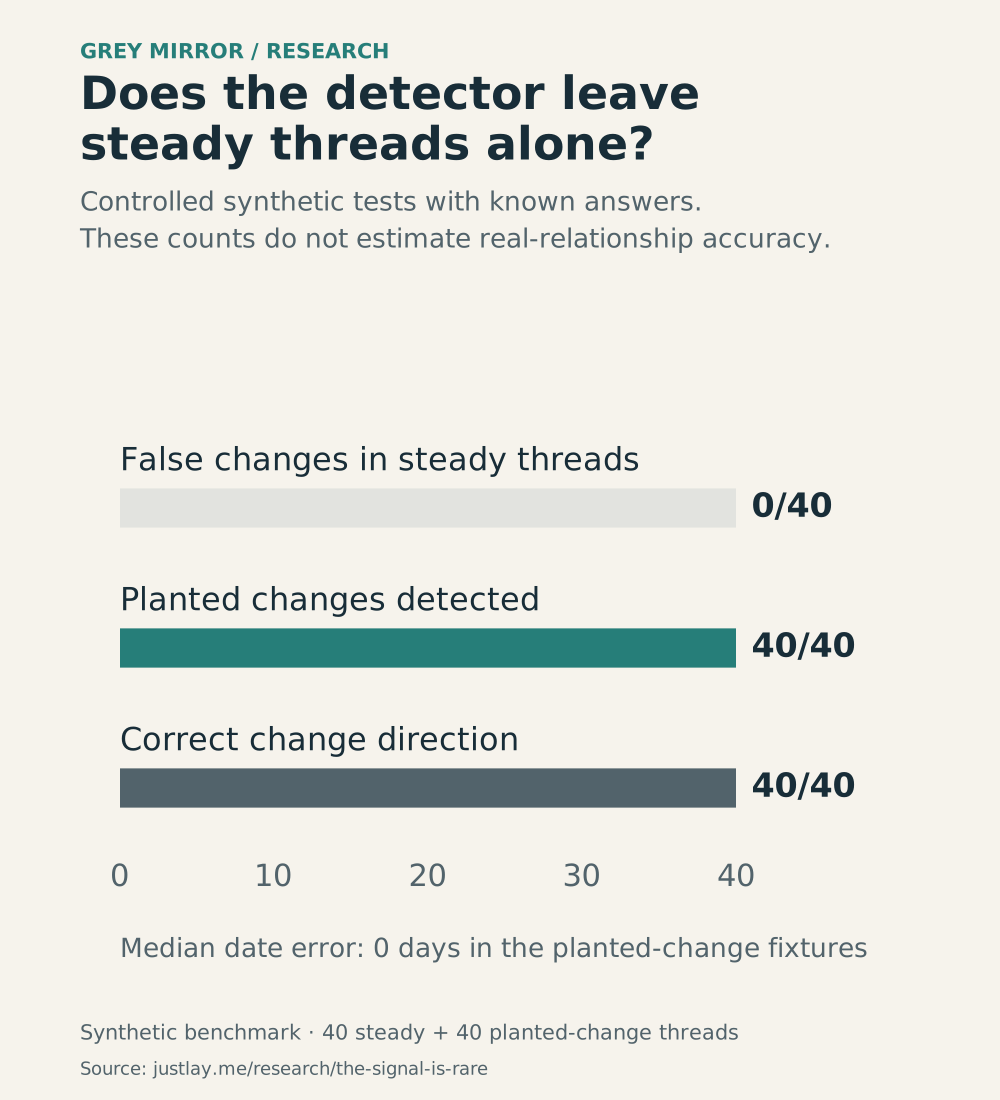
A turning-point detector needs to leave a steady conversation alone. In a separate synthetic test, it reported no changes in 40 steady threads. It detected the planted change in all 40 changed threads, identified the correct direction in those 40, and had a median date error of zero days.
These are counts from controlled fixtures with known answers. They are useful engineering checks, not an estimate of accuracy on real relationships. The benchmark page explains the fixtures and publishes the results.
Three years of building the measurement behind the story
Layne Weant spent three years building Grey Mirror: writing parsers, training classifiers, checking labels, measuring sequences and tracing findings back to the messages that produced them. His aim was to understand how a conversation changed across years. That requires more than an explanation of the last argument.
The pipeline starts with the export: timestamps, participants, message order and duplicate handling. Deterministic measurements describe starts, gaps, questions and turn-taking. Specialized classifier and transformer components identify language categories such as affection, repair and escalation. Sequence analysis compares those measurements across time, and the evidence layer connects a finding to the relevant messages and windows.
You can inspect the analyzer inventory, metric definitions and evidence standards. The work is concrete: preserve the conversation, measure its behavior, and let the reader check the interpretation against the source.
How we selected the published signal cohort
The operational rollup contained 347 conversations, 20,794,571 messages and 88 accounts. That is the starting inventory. It is not the sample supporting the findings. Of those conversations, 126 met the minimum of 500 messages spanning at least 30 days. Eligibility and curation produced the published signal cohort of 29 de-duplicated histories, 4,600,611 messages and 20 accounts.
The file manifest contained 661 records and 470 unique content hashes. The 191 repeats were duplicate file records; they were not 191 extra relationships. The run summary and reply-latency rollup were excluded from cohort findings because they could not support the required eligibility and de-duplication checks. The source audit records those decisions.
What to look for in your own conversation
Find a disagreement and read what follows it. Did either person return to the concern, acknowledge a specific action or suggest a next step? Then compare it with another disagreement, including one that went well. The useful observation is whether the response changes over time.
Compare people with their own earlier behavior. Who restarts the exchange? Do questions receive answers? Does affection get a response? Did a change persist, or was it one difficult evening? Your history can give those questions context. An aggregate study cannot supply the answer for you.
What these findings can establish
The observed histories were self-selected. They describe people who chose to have their conversations analyzed, rather than a representative sample of couples. Automated labels can be wrong, messages omit in-person exchanges, and the cohort did not contain complete relationship-outcome labels. These results therefore describe detected communication patterns; they do not establish motive, diagnosis, causality or a breakup prediction.
The two observed cohorts answer different questions and may overlap. The turning-point check uses synthetic threads. Those distinctions belong with the numbers wherever this research is cited.
The published findings, with their cohorts
signal_29 is the observed signal cohort; conflict_44 is the observed conflict cohort; turning_point_v1 is the synthetic detector test. Original units and source references are in the downloadable dataset.
| Measure | Result | Cohort | Status |
|---|---|---|---|
| no detectable emotional signal | 97.4 percent of messages | signal_29 | published |
| affection to explicit repair ratio | 10.7 ratio to 1 | signal_29 | published approximate |
| uploader message share | 53 percent | signal_29 | published descriptive |
| reply latency direction | 9 vs 13 threads by direction | signal_29 | withheld |
| median thread length | 1570 messages | conflict_44 | published descriptive |
| largest thread length | 163636 messages | conflict_44 | published descriptive |
| escalation rate | 195.3 per 1000 messages (IQR 52.6–226.2) | conflict_44 | published median and IQR |
| repair attempt rate | 5.43 per 1000 messages (IQR 3.8–7.64) | conflict_44 | published median and IQR |
| apology attempt rate | 4.31 per 1000 messages (IQR 0.91–4.59) | conflict_44 | published median and IQR |
| repair more common histories | 5 histories | conflict_44 | published count |
| pursuit skewed histories | 28 histories | conflict_44 | published count |
| withdrawal skewed histories | 10 histories | conflict_44 | published count |
| balanced histories | 6 histories | conflict_44 | published count |
| steady thread false positive rate | 0 / 40 synthetic threads | turning_point_v1 | synthetic benchmark |
| planted change detection rate | 40 / 40 synthetic threads | turning_point_v1 | synthetic benchmark |
| planted change direction accuracy | 40 / 40 synthetic threads | turning_point_v1 | synthetic benchmark |
| median localization error | 0 days | turning_point_v1 | synthetic benchmark |
The story behind the research
Layne Weant’s article in Linguistics News describes the years of engineering behind Grey Mirror and the question that started it: when did the conversation begin to change?
Read The Signal Is Rare: What Millions of Text Messages Can Tell Us About How People Communicate
Download the data or cite the study
- Aggregate findings (JSON)
- Aggregate findings (CSV)
- Methodology and definitions
- Source references
- Data dictionary
- Press notes
- Underlying relationship-texting study
- Press room and interview enquiries
Suggested citation: Weant, Layne. The Signal Is Rare. Grey Mirror by JustLayMe, Wentropy Labs. Published August 25, 2026. https://justlay.me/research/the-signal-is-rare.
Charts are free to reuse with the credit “Graphic: Grey Mirror Research” and a link to this page. Keep the cohort, unit and study scope with each figure. No private messages are included.
See what changed in your own history
Upload your conversation and follow initiation, response timing, conflict and repair across the timeline, with supporting messages you can inspect.
Grey Mirror has 30 analyzers built on up to 47 models.
Start with a completely free analysis of your entire text history, with no card required. Your free preview includes 4 evidence-linked findings. An optional full report is $17.99 USD once: your complete relationship story across the full timeline, cinematic narrative, Memory Lane, evidence, metrics, custom charts, and available results from Grey Mirror's 30-analyzer inventory. Grey Mirror Plus is $9.99/month for 1 full report credit each paid month. Unused credits carry forward; keep unlocked reports permanently.
No credit card required for the initial analysis.